I²: Interactive Real-Time Visualization for Streaming Data
This repository contains a description and a setup guide for I² - Interactive Real-Time Visualization for Streaming Data.
- Content:
- I² at EDBT 2017
- I² at FlinkForward 2017
- Introduction
- Setup Guide
- Technical Overview
I² at EDBT 2017
I² was first published at the 20th International Conference on Extending Database Technology (EDBT) in March 2017.
Abstract: Developing scalable real-time data analysis programs is a challenging task. Developers need insights from the data to define meaningful analysis flows, which often makes the development a trial and error process. Data visualization techniques can provide insights to aid the development, but the sheer amount of available data frequently makes it impossible to visualize all data points at the same time. We present I², an interactive development environment that coordinates running cluster applications and corresponding visualizations such that only the currently depicted data points are processed and transferred. To this end, we present an algorithm for the real-time visualization of time series, which is proven to be correct and minimal in terms of transferred data. Moreover, we show how cluster programs can adapt to changed visualization properties at runtime to allow in teractive data exploration on data streams.
Publication:
- Paper: I²: Interactive Real-Time Visualization for Streaming Data
- Poster: EDBT 2017 Poster
- BibTeX citation:
@inproceedings{traub2017i2,
title={I2: Interactive Real-Time Visualization for Streaming Data},
author={Traub, Jonas and Steenbergen, Nikolaas and Grulich, Philipp and Rabl, Tilmann and Markl, Volker},
booktitle={20th International Conference on Extending Database Technology (EDBT)},
pages={526--529},
year={2017}
}
I² at FlinkForward 2017
We presented I² at Flink Forward 2017 in Berlin. The I² session took place on Tuesday, Sep. 12, 12:00. The presentation is now available online. Moreover, there is a video recording available on YouTube.
Introduction
This demonstration allows for exploring our interactive I² development environment. You can test I² with several different examples. Each example is available as an Apache Zeppelin notebook.
Please notice that all notebooks require special Zeppelin features. Thus, you must use our Zeppelin fork.
All examples use the DEBS 2013 Grand Challenge dataset, which has to be stored in the Zeppelin root directory.
The Flink code is part of the respective Zeppelin Notebooks. Thus, you can find all our Flink operators included in the JSON files in the Notebooks directory.
The following examples are provided:
| Example | Description |
|---|---|
| UI-element demo | This demo explains the main foundations of our UI-Elements and shows how they can be connected to a Flink data source. |
| Football field with event counter | This notebook contains an advanced UI-element which uses [d3js]. (https://d3js.org/) |
| Interactive linechart | This Demo contains an interactive linechart. The chart displays time series data and exposes visualization properties to the running Flink job. The Flink job adapts to changed properties at runtime. |
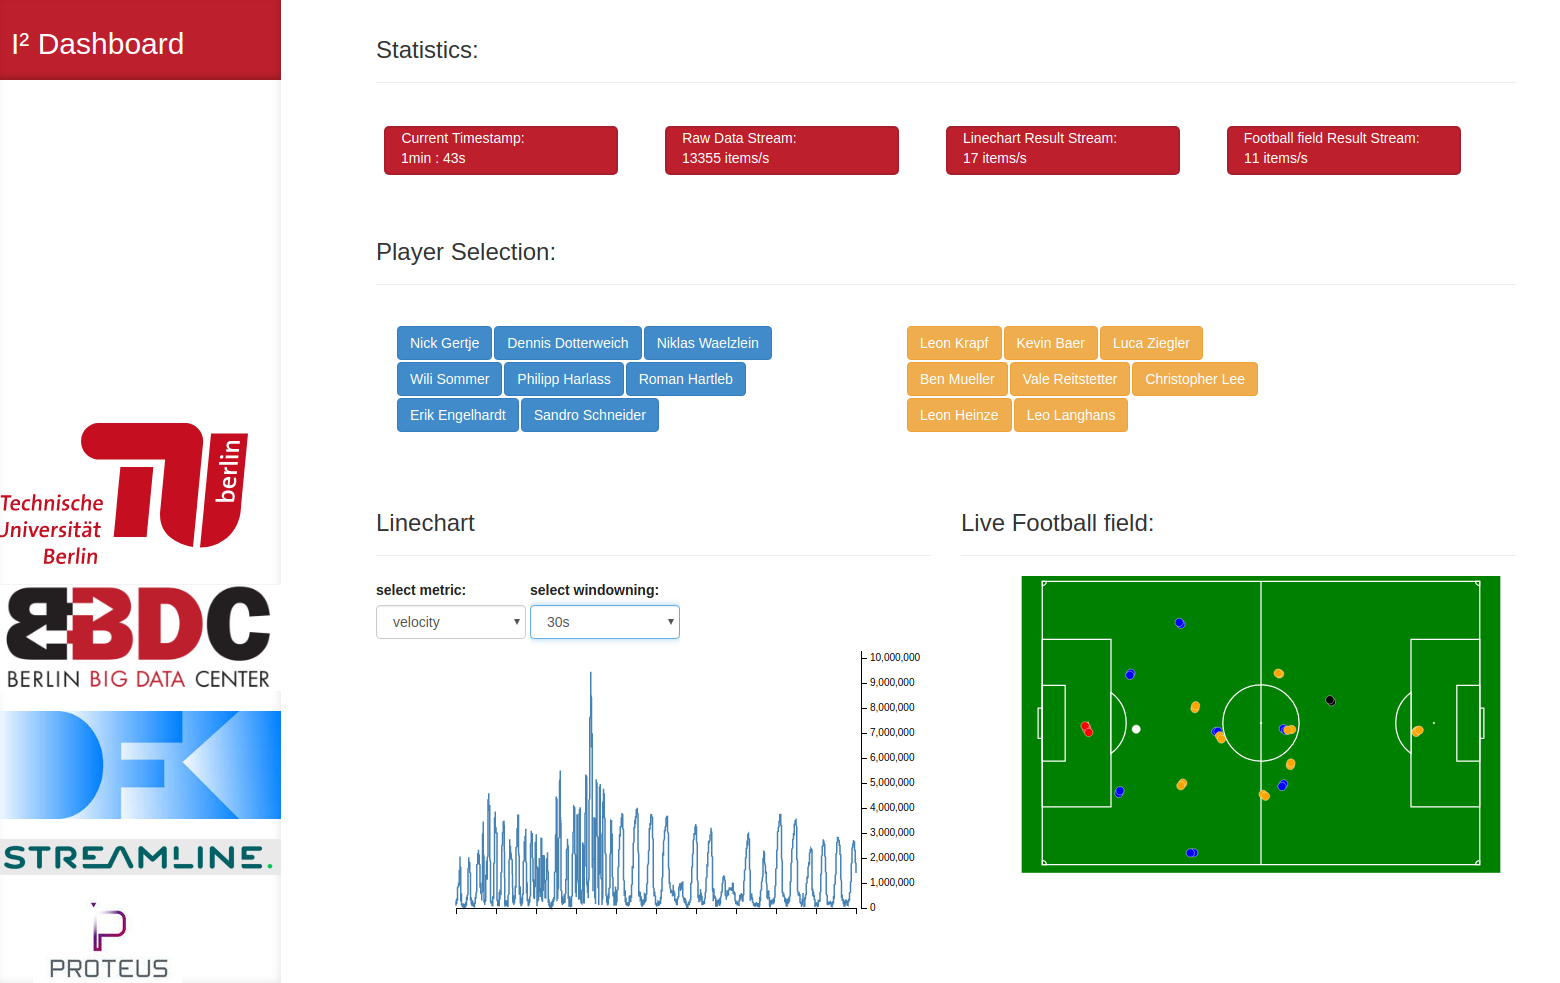
| Football dashboard | This notebook contains our full demonstrator. It combines several UI-components with a complex Flink stream processing pipeline. |
| Late event demo | This demonstration shows how we process data tuples arriving out of order. |
| Line chart without I2 - crash demo | This demo is used as motivation for the I² platform. It tries to aggregate the incoming data stream on the client side. This leads to an overload, causing an unresponsive browser tab. When you execute this demo, please be aware that you have to kill the browser tab manually. It will also be necessary to restart the Zeppelin server after the demo. |
| Ball Possession | This notebook is based on the ball possession query from the DEBS 2013 Grand Challenge. It always highlights the player who is possesses the ball. |
Setup:
You can either build all dependencies on your own or use our pre-built Docker image.
Setup with Docker:
The docker image is available via Dockerhub: https://hub.docker.com/r/tuberlindima/i2/
- Execute the following command to start the image:
sudo docker run -d --name I2-demo -p 8080:8080 -p 8081:8081 tuberlindima/i2
The Docker image exposes the following ports:
- Zeppelin UI: 8080
- Flink WebUI: 8081
- Add the example notebooks:
git clone https://github.com/TU-Berlin-DIMA/i2.git
- Import the notebooks in Zeppelin: Zeppelin Documentation
Build guide:
The I² demonstration has the following dependencies:
- RabbitMQ
- RabbitMQ must be installed on localhost with default user credentials
- Build the I² Zeppelin fork:
git clone https://github.com/TU-Berlin-DIMA/zeppelin.git- Checkout the ‘i2-demo’ branch
- Build zeppelin as described in the Zeppelin README.md.
- Download the DEBS 2013 grand challenge dataset:
wget http://lafayette.tosm.ttu.edu/debs2013/grandchallenge/full-game.gz- Extract and copy the data to the Zeppelin root directory with name
debs2013.data
- Add the example notebooks:
git clone https://github.com/TU-Berlin-DIMA/i2.git- Import the notebooks in Zeppelin: Zeppelin Documentation
- Start Zeppelin:
./bin/zeppelin-daemon.sh start
visit http://localhost:8080/
How to start the demo dashboard:
We created a simple HTML dashboard, which combines the individual UI elements from the “Football dashboard” Zeppelin notebook. You can simply open the “i2-dashboard.html” in your browser.
But you have to add the Zeppelin notebook ID as a hash parameter to the url.
For example: i2-dashboard.html#<NotebookID>
Technical Overview:
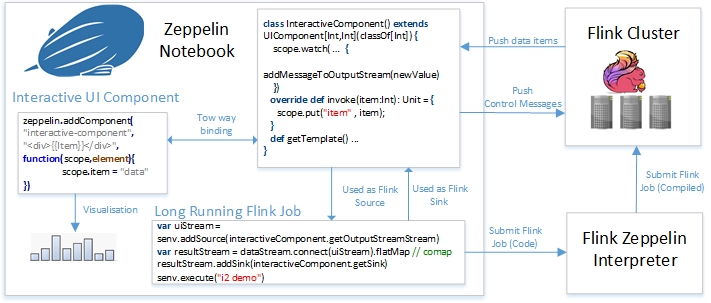
I² consists of two main concepts. First, we use Apache Zeppelin to create Apache Flink jobs. The Flink jobs contain all necessary data processing steps. Second, we create our own UI-Elements, which can be connected to a Flink Jobs as a Flink Source and a Flink Sink.
Being a data source, UI-Elements can modify properties of the running Flink jobs by sending property updates to the job. As the same time, being a data sink, UI-Elements receive output data from the job to provide the output visualization. We use RabbitMQ as a message bus between Zeppelin and Flink. RabbitMQ could also be replaced by other messaging systems such as Apache Kafka.
The image below shows the interaction between the different components:
Example:
The following example explains the different components of I². We create an UI-element which displays the last 20 tuples from a data stream. For this tasks, we first create our UI-element as a template.
UI-Element:
Each UI-element consits of a frontend portion and a backend portion. The frontend part can be a html template (for simple UI-elements) or an angular js directive (for more advanced components).
The UI-element has to be defined in its own notebook paragraph:
%angular
<style>
// Add some CSS Style
</style>
<script>
zeppelin.addComponent(
    "elementName", // replace with your element name
    "<div ng-repeat='item in items track by $index'></div>",
    function(scope,element){
      scope.items = []; // items List
      // Listen for new Items
      scope.$watch('itemHandler', function(newItem) {
         // add Item to List
         scope.items.push(newItem)
         // remove first element if list contains more than 20 elements.
         if(scope.items.length>20){
          scope.items.shift();
         }
      })
    }
)
</script>
The backend part uses the above template and connects it to an aggregation in Flink.
%flink
import org.apache.zeppelin.flink.ui._;
class OwnUIElement() extends UIComponent[(String), Any](classOf[Any]) {

   scope.remove("stream")

   override def invoke(dataItem:String) = {
     scope.put("stream" , dataItem); // send item to frontend
   }

   def getTemplate(): String = {
       "<element-name></element-name>" // [Normalization](https://docs.angularjs.org/guide/directive)
   }
}
The backend part is a Scala class, which extends the UIComponent[SinkType,SourceStype](classOf[SourceType]) class. It can be used as a Flink Souce as well as a Flink Sink.
As a Flink Sink it subscribes to output data of the Flink job by implementing the override def invoke(dataItem:SinkType) method.
To send data to the running Flink job, we can call the addMessage(item:SourceType) method.
Flink Job Integration
To make use of the UI-element, we integrate it in the processing pipeline of our Flink job.
%flink
// senv = Flink Stream Environment
val stream = senv.addSource(FlinkSource) // Add a FlinkSource
//** add aggreagations ...
val uiElement = new OwnUIElement()
stream.addSink(uiElement.getSink())
// execute the Flink job.
// This is a blocking call. It may makes sense to palce it in a separated notebook paragraph.
senv.execute()